Quantcast
Channel: Hardware – Benjr.tw
Viewing all 145 articles
Browse latest View live

HD , Network , FC –檢查 Error count

$
0
0

測試環境為 Ubuntu14.04

HD , Network , FC 這幾種常見的 I/O 介面要如何檢查是不是有產生 Error count

  • HD

    透過硬碟本身所提供的 S.M.A.R.T. (Self-Monitoring Analysis and Reporting Technology )技術 ,就可以檢測該顆硬碟的 Error count (Errors Corrected by ECC fast | delayed , Errors Corrected by rereads / rewrites , Total errors corrected , Correction algorithm invocations , Total uncorrected errors)

    root@ubuntu:~# smartctl -l error /dev/sdb
    smartctl 6.2 2013-07-26 r3841 [x86_64-linux-3.13.0-24-generic] (local build)
    Copyright (C) 2002-13, Bruce Allen, Christian Franke, www.smartmontools.org
    
    === START OF READ SMART DATA SECTION ===
    Error counter log:
               Errors Corrected by           Total   Correction     Gigabytes    Total
                   ECC          rereads/    errors   algorithm      processed    uncorrected
               fast | delayed   rewrites  corrected  invocations   [10^9 bytes]  errors
    read:          0        0         0         0          0     123263.011           0
    write:         0        0         0         0          0       5218.671           0
    verify:        0        0         0         0          0         24.721           0
    
    Non-medium error count:      148
    
  • Network

    指令 #ip 加入參數 -s (statistics) 就可以看到 RX (Receive) , TX (Transmit) packets , errors , dropped , overrun , mcast , arrier , collsns 等統計資料.

    root@ubuntu:~# ip -s link
    1: lo: <LOOPBACK,UP,LOWER_UP> mtu 65536 qdisc noqueue state UNKNOWN mode DEFAULT
        link/loopback 00:00:00:00:00:00 brd 00:00:00:00:00:00
        RX: bytes  packets  errors  dropped overrun mcast
        0          0        0       0       0       0
        TX: bytes  packets  errors  dropped carrier collsns
        0          0        0       0       0       0
    2: eth0: <BROADCAST,MULTICAST,UP,LOWER_UP> mtu 1500 qdisc pfifo_fast state UP mode DEFAULT qlen 1000
        link/ether 08:00:27:cb:a9:8b brd ff:ff:ff:ff:ff:ff
        RX: bytes  packets  errors  dropped overrun mcast
        2756198    8601     0       0       0       0
        TX: bytes  packets  errors  dropped carrier collsns
        682123     7551     0       0       0       0
    
  • FC

    TBD


Linux command – sfck

$
0
0

系統有一顆硬碟壞了,抽出來到別台 RedHat RHEL 6.5 檢查得到一個無情的結果

  
[root@localhost Desktop]# fsck -y /dev/sdb1
fsck from util-linux 2.20.1
e2fsck 1.42.9 (4-Feb-2014)
ext2fs_open2: Bad magic number in super-block
fsck.ext2: Superblock invalid, trying backup blocks...
fsck.ext2: Bad magic number in super-block while trying to open /dev/sdb1

The superblock could not be read or does not describe a valid ext2/ext3/ext4
filesystem.  If the device is valid and it really contains an ext2/ext3/ext4
filesystem (and not swap or ufs or something else), then the superblock
is corrupt, and you might try running e2fsck with an alternate superblock:
    e2fsck -b 8193 <device>
 or
    e2fsck -b 32768 <device>

無效的 Superblock 是代表?

先來看看 Linux 下的檔案儲存是採用什麼方式,他採用了 superblock / inode /data block 的方式來儲存資料.

data block

資料在儲存時不太可能每一次都有連續的空間可供資料的儲存,所以資料會切割成固定大小分開存放,這大小的空間就是 data block 但在談 data block 大小前,先來說說硬碟的儲存最小單位 block size ,通常硬碟在出廠前都先經過低階格式化,而預設的大小就是 512bytes , 但512bytes 真的太小所以在 Linux 下我們用的是另外一種單位就是 data block ,而他的大小必須為 512bytes 的倍數. 512,1024,2048,4096 bytes 通常在 Linux 下為 4096bytes.Data, Data block 與 block 的相關如下所是.

Data –> Data block(s) –> block(s)

inode

剛剛說到 data block 的資料是一塊塊分散的儲存(索引式檔案系統),所以此時必須要一塊資料要紀錄哪些 data block 是屬於哪一個 data 的, 而記錄了這些資料的就叫做 inode ,每一個檔案都會對應到一個 inode 他的大小為 128bytes 除了紀錄 data block 的位置外還儲放了檔案的權限與相關屬性.

superblock

那剛剛 inode/block 的使用情況(使用量,剩餘…)是由誰來紀錄,就是透過 superblock 基本上他記錄該檔案系統所有的資訊. 所以我們可以很清楚了解 superblock / inode / data block 的關係.

superblock –>inode –> data block

更多有關於 Linux 的檔案系統可以參考 http://benjr.tw/93162

那 無效的 Superblock 應該就 GG 了.

不過我們還是來看一下正常情況要怎麼救.

被掛載的磁區是不能做 fsck ,如果是系統碟那就要用其他方式開機再來下 fsck 指令.

[root@localhost Desktop]# fsck /dev/sdb7
fsck from util-linux 2.20.1
e2fsck 1.42.9 (4-Feb-2014)
/dev/sdb7 is mounted.
e2fsck: Cannot continue, aborting.

常用的兩個參數 -y , -a 都是可以做自動修復,不需要一一輪詢.

  • -y
    For some filesystem-specific checkers, the -y option will cause the fs-specific fsck to always attempt to fix any detected filesystem corruption automatically.
  • -a
    Automatically repair the filesystem without any questions.

沒有下參數 -y 或是 -a 系統會一直詢問你是否修復.

 
[root@localhost Desktop]# fsck /dev/sdb6
fsck from util-linux 2.20.1
e2fsck 1.42.9 (4-Feb-2014)
Superblock has an invalid journal (inode 8).
Clear<y>? yes
*** ext3 journal has been deleted - filesystem is now ext2 only ***

/dev/sdb6 was not cleanly unmounted, check forced.
Pass 1: Checking inodes, blocks, and sizes
Journal inode is not in use, but contains data.  Clear<y>? yes
yInode 10000, i_blocks is 249376, should be 224800.  Fix<y>? yes
Inode 49537, i_blocks is 10280, should be 112.  Fix<y>? yes
Inode 49541, i_blocks is 2080, should be 104.  Fix<y>? yes
Inode 49549, i_blocks is 160, should be 104.  Fix<y>? yes
[root@localhost Desktop]# fsck -a /dev/sdb6
fsck from util-linux 2.20.1
/dev/sdb6 was not cleanly unmounted, check forced.
/dev/sdb6: Inode 270816, i_blocks is 24296, should be 16512.  FIXED.
/dev/sdb6: Inode 270611, i_blocks is 15560, should be 8304.  FIXED.
/dev/sdb6: Inode 270818, i_blocks is 1512, should be 104.  FIXED.
[root@localhost Desktop]# fsck -y /dev/sdb6
...
/dev/sdb6: ***** FILE SYSTEM WAS MODIFIED *****
/dev/sdb6: 340410/655776 files (0.6% non-contiguous), 2374655/2622603 blocks

fsck 與 e2fsck 的差別是!!

  • fsck is used to check and optionally repair one or more Linux filesys‐tems.
  • e2fsck is used to check the ext2/ext3/ext4 family of file systems.

e2fsck 是針對 ext2/ext3/ext4 而 fsck 支援多種檔案格式.

[root@localhost Desktop]# ll fsck*
-rwxr-xr-x 1 root root 30540 Sep  2  2015 fsck*
-rwxr-xr-x 1 root root 13820 Sep  2  2015 fsck.cramfs*
lrwxrwxrwx 1 root root     6 Sep  9  2015 fsck.ext2 -> e2fsck*
lrwxrwxrwx 1 root root     6 Sep  9  2015 fsck.ext3 -> e2fsck*
lrwxrwxrwx 1 root root     6 Sep  9  2015 fsck.ext4 -> e2fsck*
lrwxrwxrwx 1 root root     6 Sep  9  2015 fsck.ext4dev -> e2fsck*
-rwxr-xr-x 1 root root 54900 May 26 05:22 fsck.fat*
-rwxr-xr-x 1 root root 30292 Sep  2  2015 fsck.minix*
lrwxrwxrwx 1 root root     8 May 26 05:22 fsck.msdos -> fsck.fat*
-rwxr-xr-x 1 root root   333 Feb 16  2016 fsck.nfs*
lrwxrwxrwx 1 root root     8 May 26 05:22 fsck.vfat -> fsck.fat*   

那如果是 VLM 的檔案格式要怎麼處理? 什麼是 LVM http://benjr.tw/174

我們要先找出來當初訂的 LV (LVM 的組成為 PV – VG – LV)

[root@localhost Desktop]# pvscan
[root@localhost Desktop]# vgscan
[root@localhost Desktop]# lvscan

Volume Group active

[root@localhost Desktop]# vgchange -ay

使用 fsck 修復 LVM 檔案系統.

[root@localhost Desktop]# e2fsck -f /dev/VolGroup00/LogVol01

iPXE

$
0
0

之前使用的 PXE 環境都是使用 “pxelinux.0″ (這個檔案由 Syslinux 套件提供) PXELinux 提供的功能比較簡單,只能透過 DHCP , TFTP 協定與設定檔來進行網路開機的作業.請參考 http://benjr.tw/83

同性質的 PXE 還有 iPXE 官方網站說明 http://ipxe.org/start

iPXE is the leading open source network boot firmware. It provides a full PXE implementation enhanced with additional features such as:

  • boot from a web server via HTTP
  • boot from an iSCSI SAN
  • boot from a Fibre Channel SAN via FCoE
  • boot from an AoE SAN
  • boot from a wireless network
  • boot from a wide-area network
  • boot from an Infiniband network
  • control the boot process with a script

You can use iPXE to replace the existing PXE ROM on your network card, or you can chainload into iPXE to obtain the features of iPXE without the hassle of reflashing.

傳統的網卡 ROM 裡面存放了一些基本的網路協定如: Internet Protocol (IP), User Datagram Protocol (UDP), Dynamic Host Configuration Protocol (DHCP) 以及 Trivial File Transfer Protocol (TFTP) 透過這一些協定使得 PXE 可以進行網路的存取進一步取得網路上的資源.
iPXE 可以直接把它燒錄到 網卡 ROM 內,或是透過一般的 PXE ROM 開機,但後續的工作環境透過 iPXE 來運作並搭配他的 Script + command line http://ipxe.org/cmd 命令列指令來操作 .

我還沒有實際使用過,參考文件
https://godleon.github.io/blog/2016/07/01/Linux-PXE-Booting

除了 PXELinux 與 iPXE 外還有 gPXE .不過 gpxe 官方網站似乎 http://www.etherboot.org 都連不上了.

LXC (Linux Containers)

$
0
0

虛擬化的種類很多 Full Virtualization (Paravirtualization , Hardware-assisted virtualization) , OS-Level Virtualization ,那 LXC 算是哪種虛擬化?

LXC 提供類似於作業系統層級的虛擬化 OS-Level Virtualization ,先來看看之前所謂的 作業系統層級的虛擬化 .
hosted_vm
作業系統層級的虛擬化是透過 VMM (Virtual Machine Monitor,也可以稱作 Hybervisor) 建立一個虛擬化的環境給虛擬機的作業系統來使用,幾乎所有的作業系統我們都可以透過這樣的方式模擬出來,但相對的是效能差以及消耗過多的系統資源.

所以 LXC 採用與 KVM 一樣的做法 (Linux 核心加入 KVM 再讓這 Linux 核心當作 VMM ,在 KVM 下的 Guest OS 對於 Linux 核心而言都只是一個 Process 行程). LXC 採用類似的方式在原作業系統中透過資源共享的方式,建立出一個獨立空間 (虛擬環境,有自己的 file system, process 與 block I/O ,network 空間) 給另外一個作業系統來使用,這邊不再稱它為虛擬機器 Virtual Machine 而是叫做 Container.
lxc01
從 Linux 核心 2.6.24 之後的版本內建了 Control Group 和 Namespaces 機制,這些機制讓 LXC 可以分配 Host OS 的資源給 Containers.這種做法跟 chroot 類似.但 LXC 多了 IP address, a separate process domain, user ids 以及 dedicated access to the host’s physical resources (i.e. memory, CPU) .

那什麼是 Control Group 和 Namespaces ? TBD
The Linux kernel provides the cgroups functionality that allows limitation and prioritization of resources (CPU, memory, block I/O, network, etc.) without the need for starting any virtual machines, and also namespace isolation functionality that allows complete isolation of an applications’ view of the operating environment, including process trees, networking, user IDs and mounted file systems.

KVM 與 LXC 的差別!
主要的差別是 KVM 的虛擬機器還需要安裝作業系統之後才能執行應用程式,而 Container 與 Linux Kernel 共享核心,只需要相關程式碼 (Binaries),函式庫 (libraries),以及 根目錄架構 所建立出來的獨立環境,就可以開始執行應用程式.
kvm_lxc01
在第一次新增 Ubuntu container 就會自行透過網路下載所需的 程式碼 (Binaries),函式庫 (libraries),以及 根目錄架構 環境,因為都已經打包好下載之後就可以接執行 Container,不需要額外的安裝作業系統等工作.

root@ubuntu:~# lxc-create -n ubuntu-1 -t ubuntu
Checking cache download in /var/cache/lxc/trusty/rootfs-i386 ... 
Installing packages in template: ssh,vim,language-pack-en
Downloading ubuntu trusty minimal ...

關於 LXC 的使用請參考 http://benjr.tw/93708

LXC – Network

$
0
0

前面有討論到 LXC 虛擬化 http://benjr.tw/95955 與 Ubuntu LXC 的使用 http://benjr.tw/93708 ,這邊我們來看看關於 LXC 的網路架構.

安裝完 LXC 會發現多了一個網路埠 lxcbr0

root@ubuntu:~# ifconfig
...
lxcbr0    Link encap:Ethernet  HWaddr 9e:da:df:05:e4:d0  
          inet addr:10.0.3.1  Bcast:10.0.3.255  Mask:255.255.255.0
          inet6 addr: fe80::9cda:dfff:fe05:e4d0/64 Scope:Link
          UP BROADCAST RUNNING MULTICAST  MTU:1500  Metric:1
          RX packets:0 errors:0 dropped:0 overruns:0 frame:0
          TX packets:52 errors:0 dropped:0 overruns:0 carrier:0
          collisions:0 txqueuelen:0 
          RX bytes:0 (0.0 B)  TX bytes:7965 (7.9 KB)

我們來看看這個網路埠 lxcbr0 的設定值.

root@ubuntu:~# nano /etc/default/lxc-net
USE_LXC_BRIDGE="true"
LXC_BRIDGE="lxcbr0"
LXC_ADDR="10.0.3.1"
LXC_NETMASK="255.255.255.0"
LXC_NETWORK="10.0.3.0/24"
LXC_DHCP_RANGE="10.0.3.2,10.0.3.254"

Linux 網路提供 Bridge mode 他可以透過 Linux 模擬一個 switch 來使用了,LXC 的網卡就是單純透過虛擬的 switch 與 Host 端網卡相聯接.還提供 DHCP Server 的服務.
下面的圖示你可以很清楚的看出來虛擬 NIC 是如何透過 bridge 模式串接在一起.
VMwarePlayer33

  • USE_LXC_BRIDGE="true"
    是否使用 LXC Bridge 功能.
  • LXC_BRIDGE="lxcbr0″
    該 Bridge 的名稱 lxcbr0
  • LXC_ADDR="10.0.3.1″
    該 Bridge 的 IP
  • LXC_NETMASK="255.255.255.0″
    該 Bridge 的網段遮罩.
  • LXC_NETWORK="10.0.3.0/24″
    該 Bridge 的網段 10.0.3.0/24 (255.255.255.0)
  • LXC_DHCP_RANGE="10.0.3.2,10.0.3.254″
    這 Bridge 提供 DHCP 的功能,IP 範圍 10.0.3.2 ~ 10.0.3.254

我們可以透過 # brctl show 是觀察這個 Bridge 的狀態.

root@ubuntu:~# brctl show
bridge name	bridge id		STP enabled	interfaces
lxcbr0		8000.000000000000	no

啟動 Ubuntu-1 與 Ubuntu-2 Containers ,可以觀察到他們的網路裝置 (veth40YLD4 , vethV0JUNP) 會掛載在這一個 Bridge 上

root@ubuntu:~# lxc-start -n ubuntu-1 -d
root@ubuntu:~# lxc-start -n ubuntu-2 -d
root@ubuntu:~# brctl show
bridge name	bridge id		STP enabled	interfaces
lxcbr0		8000.feb9422336e4	no		veth40YLD4
							vethV0JUNP

在 Ubuntu-2 Container 也是可以 ping 得到該 Bridge IP:10.0.3.1

ubuntu@ubuntu-2:~$ ping 10.0.3.1
PING 10.0.3.1 (10.0.3.1) 56(84) bytes of data.
64 bytes from 10.0.3.1: icmp_seq=1 ttl=64 time=0.084 ms
64 bytes from 10.0.3.1: icmp_seq=2 ttl=64 time=0.098 ms
64 bytes from 10.0.3.1: icmp_seq=3 ttl=64 time=0.117 ms
^C
--- 10.0.3.1 ping statistics ---
3 packets transmitted, 3 received, 0% packet loss, time 1999ms
rtt min/avg/max/mdev = 0.084/0.099/0.117/0.017 ms

VNC – tigervnc

$
0
0

測試環境為 CentOS 7 Minimal Install.測試環境建議可以先關閉 firewall 與 selinux http://benjr.tw/95368

先來討論一下 Minimal Install 可以使用 VNC 嗎?

我們得先了解 X-Window 的運作方式, X Server 負責顯示介面與繪圖,並將使用者的輸入行為告知 X Client,而 X client application 則是負責產生繪圖的數據並回傳給 X Server,通常我們的 dispaly server 和 client application 都是在同一台電腦上面.

所以第一步還是要先幫 CentOS 安裝 GNOME 桌面系統 (GNOME Desktop),不可能一個一個套件安裝,可以直接透過 group install 即可.關於 group install 可以參考 http://benjr.tw/96155

[root@localhost ~]# yum groups install "GNOME Desktop"
Loaded plugins: fastestmirror
There is no installed groups file.
Maybe run: yum groups mark convert (see man yum)
Loading mirror speeds from cached hostfile
 * base: centos.cs.nctu.edu.tw
 * extras: centos.cs.nctu.edu.tw
 * updates: centos.cs.nctu.edu.tw
Resolving Dependencies
--> Running transaction check
---> Package ModemManager.x86_64 0:1.1.0-8.git20130913.el7 will be installed
--> Processing Dependency: ModemManager-glib(x86-64) = 1.1.0-8.git20130913.el7 for package: ModemManager-1.1.0-
....
[root@localhost ~]# reboot

再來安裝 CentOS 7 所使用的 TigerVNC.這跟之前使用的 VNC http://benjr.tw/715 不太一樣.

[root@localhost ~]# yum install tigervnc-server

接下來啟動 vncserver 即可.

[root@localhost ~]# vncserver

You will require a password to access your desktops.

Password:
Verify:
xauth:  file /root/.Xauthority does not exist

New 'localhost.localdomain:1 (root)' desktop is localhost.localdomain:1

Creating default startup script /root/.vnc/xstartup
Starting applications specified in /root/.vnc/xstartup
Log file is /root/.vnc/localhost.localdomain:1.log

localhost.localdomain:1 (root) 的意思是說,啟動一個 VNC 在 port 5900+1 即 5901 , vncviewer 可以透過這個埠連線,使用者為 root.
我們可以透過 netstat 來確認一下.

[root@localhost ~]# yum install net-tools
[root@localhost ~]# netstat -tlnp |grep -i 59
tcp        0      0 0.0.0.0:5901            0.0.0.0:*               LISTEN      10136/Xvnc          
tcp6       0      0 :::5901                 :::*                    LISTEN      10136/Xvnc 

的確在 0.0.0.0:5901 已經開啟 VNC ,這時候就可以透過 vncviewer 去與遠端連線了.VNC 連線後等左上方的顯示訊息跑完就可以看到遠端桌面.
tigervnc01

如果要讓 VNC 在開機的時候就啟動可以透過

  • Copy this file to /etc/systemd/system/vncserver@.service
  • Edit and vncserver parameters appropriately (“runuser -l -c /usr/bin/vncserver %i -arg1 -arg2″)
  • Run `systemctl daemon-reload`
  • Run `systemctl enable vncserver@:.service`

詳細步驟請參考 https://www.digitalocean.com/community/tutorials/how-to-install-and-configure-vnc-remote-access-for-the-gnome-desktop-on-centos-7

如果只是想要單純把 Linux X-window 的程式執行畫面傳過來,其實透過 SSH + X11 forwarding – http://benjr.tw/3285 就可以了.

QEMU machine emulator (Ubuntu)

$
0
0

測試環境 Ubuntu 16.04 (X86_64)

如何在 x86_64 環境下產生非 x86_64 的虛擬機器.這就需要透過 QEMU machine emulator 透過全模擬的方式來做.

在使用 QEMU machine emulator 前,我們先來看看 QEMU 三種不同的模擬方式 machine emulator , virtualizer 在加上 KVM.

  • machine emulator (User mode emulation)
    當 QEMU 當成 machine emulator 時他可以在不同的機器(例如 x86 x64 PC) 上運行另外一種型態的一個機器 如 ARM (一種常用於可攜式裝置的處理器) 的處理器 的系統和程序,使用的技術叫做動態翻譯 (dynamic translation).藉此可以得到較佳的較能.
  • virtualizer (System mode)
    當 QEMU 當成 virtulizer 時可以以模擬的方式模擬出一台 PC ,包含了 CPU 以及其他的周邊裝置,所以透過這種方式,QEMU 可以模擬出不同的硬體出來,如 x86, AMD64, ARM, Alpha, ETRAX CRIS, MIPS, MicroBlaze 和 SPARC.
    透過 QEMU 這種全模擬的方式就可以在 x86_64 環境下產生非 x86_64 的虛擬機器.
  • virtualizer (System mode)+KVM
    前面的效能不會太好,所以新的方式是透過 CPU 硬體的支援 – Intel VT 或者 AMD-V,而且要搭配必 Linux KVM 時才可以使用,這時候 QEMU 可以直接在主機的 CPU 上執行虛擬機的請求來實現接近本機的效能.

    為了解決 Guest OS 的核心無法處在 Ring 0 所以將 CPU 的操作畫分成兩種不同等級,一是 VMX root operation(根虛擬化操作).這邊就是提供給 VMM(Virtual Machine Monitor) 也可以稱作 Hybervisor 來使用,二是 VMX non-root operation(非根虛擬化操作) 這邊就可以提供給 Guest OS 來使用,並以傳統的方式將 Ring 劃分為 4 個等級 (Privileges levels).此時 Guest OS 的核心就可以在 Ring 0 下操作,也不會有效能上的損益( overhead )的問題了.

    關於 X86-64 虛擬化,請參考 http://benjr.tw/3407

    至於 ARM 處理器,到了 ARMv8-A 64bits 也開始支援類似這樣的模式,他定義了四個層級,從 EL0 到 EL3 , 數字越大 特權 (privilege) 越大.

    1. EL0: unprivileged
    2. EL1: OS kernel mode
    3. EL2: Hypervisor mode (VHE : Virtualization Host Extension)
    4. EL3: TrustZone® monitor mode

    其他關於
    KVM 請參考 http://benjr.tw/3620
    KVM + QEMU 請參考 http://benjr.tw/3631

要在 Ubuntu 使用 QEMU 所需套件為:

root@ubuntu:~# apt-get install qemu-kvm libvirt-bin virtinst virt-manager bridge-utils
  • qemu-kvm: QEMU virtualization
  • virtinst: Command line tool to create virtual machines.
  • libvirt-bin: Provides libvirtd daemon that manages virtual machines and controls hypervisor.
  • virt-manager: GUI tool to create virtual machines.

詳細設定請參考 http://benjr.tw/96185,這樣就可以透過 QEMU + KVM 建立虛擬機器.但沒有辦法在 x86_64 環境下產生非 x86_64 的虛擬機器.

我們可以在 Create a new virtual machine , step 5 of 5 , Advanced options 可以看到 Virt Type 為 KVM.
qemu_kvm01

其他全模擬的方式則需要個別的 QEMU 套件來支援.

  • qemu: No summary available for qemu in ubuntu saucy.
  • qemu-common: No summary available for qemu-common in ubuntu saucy.
  • qemu-guest-agent: No summary available for qemu-guest-agent in ubuntu saucy.
  • qemu-keymaps: QEMU keyboard maps
  • qemu-system: QEMU full system emulation binaries
  • qemu-system-arm: No summary available for qemu-system-arm in ubuntu saucy.
  • qemu-system-common: QEMU full system emulation binaries (common files)
  • qemu-system-mips: QEMU full system emulation binaries (mips)
  • qemu-system-misc: No summary available for qemu-system-misc in ubuntu saucy.
  • qemu-system-ppc: QEMU full system emulation binaries (ppc)
  • qemu-system-sparc: No summary available for qemu-system-sparc in ubuntu saucy.
  • qemu-system-x86: QEMU full system emulation binaries (x86)
  • qemu-user: No summary available for qemu-user in ubuntu saucy.
  • qemu-user-static: No summary available for qemu-user-static in ubuntu saucy.
  • qemu-utils: No summary available for qemu-utils in ubuntu saucy.

安裝 qemu-system-arm 套件就可以靠 QEMU 模擬成 ARM 處理器.

root@ubuntu:~# apt-get install qemu-system-arm

qemu_kvm02

Linux command – smartctl (-t)

$
0
0

指令 #smartctl – http://benjr.tw/95984 是透過硬碟本身所提供的 S.M.A.R.T. (Self-Monitoring Analysis and Reporting Technology )技術 ,他可以根據檢測屬性的結果來決定該顆硬碟的使用是否快故障.

我們可以透過 #smartctl 提供的參數 -t 來進行測試. 測試環境為 Ubuntu14.04 .

-t TEST, –test=TEST

這邊會列出可供測試的項目.

root@ubuntu:~# smartctl -t /dev/sdb
smartctl 6.2 2013-07-26 r3841 [x86_64-linux-3.13.0-24-generic] (local build)
Copyright (C) 2002-13, Bruce Allen, Christian Franke, www.smartmontools.org

=======> INVALID ARGUMENT TO -t: /dev/sdb
=======> VALID ARGUMENTS ARE: offline, short, long, conveyance, force, vendor,N, select,M-N, pending,N, afterselect,[on|off] =======

Use smartctl -h to get a usage summary

來試試看 short , long 測試,測試會在背景執行,需要透過 -l selftest 來觀看目前的測試進度與結果.

root@ubuntu:~# smartctl -t short /dev/sdb
smartctl 6.2 2013-07-26 r3841 [x86_64-linux-3.13.0-24-generic] (local build)
Copyright (C) 2002-13, Bruce Allen, Christian Franke, www.smartmontools.org

Short Background Self Test has begun
Use smartctl -X to abort test
root@ubuntu:~# smartctl -t long /dev/sdb
smartctl 6.2 2013-07-26 r3841 [x86_64-linux-3.13.0-24-generic] (local build)
Copyright (C) 2002-13, Bruce Allen, Christian Franke, www.smartmontools.org

Extended Background Self Test has begun
Please wait 34 minutes for test to complete.
Estimated completion time: Tue Nov  1 16:15:59 2016

Use smartctl -X to abort test
root@ubuntu:~# smartctl -l selftest /dev/sdb
smartctl 6.2 2013-07-26 r3841 [x86_64-linux-3.13.0-24-generic] (local build)
Copyright (C) 2002-13, Bruce Allen, Christian Franke, www.smartmontools.org

=== START OF READ SMART DATA SECTION ===
Self-test execution status:		96% of test remaining
SMART Self-test log
Num  Test              Status                 segment  LifeTime  LBA_first_err [SK ASC ASQ]
     Description                              number   (hours)
# 1  Background long   Self test in progress ...   -     NOW                 - [-   -    -]
# 2  Background short  Completed                   -   19184                 - [-   -    -]
Long (extended) Self Test duration: 2040 seconds [34.0 minutes]

這些測試到底測了什麼? 參考文章 https://www.thomas-krenn.com/en/wiki/SMART_tests_with_smartctl#Short_Test

  • Short
    The goal of the short test is the rapid identification of a defective hard drive. Therefore, a maximum run time for the short test is 2 min. The test checks the disk by dividing it into three different segments. The following areas are tested:
    1. Electrical Properties: The controller tests its own electronics, and since this is specific to each manufacturer, it cannot be explained exactly what is being tested. It is conceivable, for example, to test the internal RAM, the read/write circuits or the head electronics.
    2. Mechanical Properties: The exact sequence of the servos and the positioning mechanism to be tested is also specific to each manufacturer.
    3. Read/Verify: It will read a certain area of ​​the disk and verify certain data, the size and position of the region that is read is also specific to each manufacturer.
  • Extended (or Long; a short check with complete disk surface examination)
    The long test was designed as the final test in production and is the same as the short test with two differences. The first: there is no time restriction and in the Read/Verify segment the entire disk is checked and not just a section. The Long test can, for example, be used to confirm the results of the short tests.
  • Conveyance
    This test can be performed to determine damage during transport of the hard disk within just a few minutes.
  • Select Tests
    During selected tests the specified range of LBAs is checked. The LBAs to be scanned are specified in the following formats:
    # sudo smartctl -t select,10-20 /dev/sdc
    # sudo smartctl -t select,10+11 /dev/sdc
    

    It is also possible to have multiple ranges, (up to 5), to scan:

    # sudo smartctl -t select,0-10 -t select,5-15 -t select,10-20 /dev/sdc
    

Linux command – Memtester

$
0
0

之前用過 Memtest86+ http://benjr.tw/491 ,無法直接在 Linux 環境下直接來使用,Memtester 可以直接在 Linux 環境下執行,且可以從 apt-get 下載使用,官方網站 http://pyropus.ca/software/memtester/

root@ubuntu:~# apt-get install memtester
Reading package lists... Done
Building dependency tree       
Reading state information... Done
The following packages were automatically installed and are no longer required:
  linux-headers-4.4.0-31 linux-headers-4.4.0-31-generic
  linux-image-4.4.0-31-generic linux-image-extra-4.4.0-31-generic
Use 'apt autoremove' to remove them.
The following NEW packages will be installed:
  memtester
0 upgraded, 1 newly installed, 0 to remove and 8 not upgraded.
Need to get 16.2 kB of archives.
After this operation, 66.6 kB of additional disk space will be used.
Get:1 http://us.archive.ubuntu.com/ubuntu xenial/universe amd64 memtester amd64 4.3.0-3 [16.2 kB]
Fetched 16.2 kB in 1s (11.6 kB/s)                      
Selecting previously unselected package memtester.
(Reading database ... 242316 files and directories currently installed.)
Preparing to unpack .../memtester_4.3.0-3_amd64.deb ...
Unpacking memtester (4.3.0-3) ...
Processing triggers for man-db (2.7.5-1) ...
Setting up memtester (4.3.0-3) ...

使用上也很簡單,只需要指定要測試的記憶體大小 (單位: B/K/M/G) 以及測試次數 (Loops) 即可.

Usage: memtester [-p physaddrbase [-d device]] <mem>[B|K|M|G] [loops]

我的系統是 Ubuntu16.04 1G 記憶體 的 VMware 虛擬機器.

root@ubuntu:~# memtester 200M 1
memtester version 4.3.0 (64-bit)
Copyright (C) 2001-2012 Charles Cazabon.
Licensed under the GNU General Public License version 2 (only).

pagesize is 4096
pagesizemask is 0xfffffffffffff000
want 200MB (209715200 bytes)
got  200MB (209715200 bytes), trying mlock ...locked.
Loop 1/1:
  Stuck Address       : ok         
  Random Value        : ok
  Compare XOR         : ok
  Compare SUB         : ok
  Compare MUL         : ok
  Compare DIV         : ok
  Compare OR          : ok
  Compare AND         : ok
  Sequential Increment: ok
  Solid Bits          : ok         
  Block Sequential    : ok         
  Checkerboard        : ok         
  Bit Spread          : ok         
  Bit Flip            : ok         
  Walking Ones        : ok         
  Walking Zeroes      : ok         
  8-bit Writes        : ok
  16-bit Writes       : ok

Done.

Memtester 主要會針對記憶體做以下的測試

  1. Stuck Address
  2. Random Value -test random value
  3. Compare XOR – test xor comparison
  4. Compare SUB – test sub comparison
  5. Compare MUL – test mul comparison
  6. Compare DIV – test div comparison
  7. Compare OR – test or comparison
  8. Compare AND – test and comparison
  9. Sequential Increment – test seqinc comparison
  10. Solid Bits – test solidbits comparison
  11. Block Sequential – test blockseq comparison
  12. Checkerboard – test checkerboard comparison
  13. Bit Spread – test bitspread comparison
  14. Bit Flip – test bitflip comparison
  15. Walking Ones – test walk bits 1 comparison
  16. Walking Zeroes – test_walk bits 0 comparison
  17. 8-bit Writes – test 8bit wide random
  18. 16-bit Writes -test 16bit wide random

memtester 是透過 malloc 函數來要求記憶體空間,所以在設定測試記憶體空間時沒有辦法把全部的記憶體都拿來測試.

root@ubuntu:~# free
              total        used        free      shared  buff/cache   available
Mem:         998312      158264      740632          80       99416      698696
Swap:       1046524      492832      553692

透過 free 可以看到,系統大概還有 700M 可以用,所以上限大概也就在這裡.
Linux 底下記憶體的使用區分下面幾種.

  • Total Memory
    系統所有的記憶體容量.
  • Used Memory
    Total(998,312) – Free(740632) – Buffers/Cache(99416) 就是目前所有有在使用中的記憶體數量.
  • Free Memory
    尚未使用到的的記憶體.
  • shared Memory
    used by tmpfs , 允許 processes (程序) 透過 Shared memory 共享儲存於記憶體中的 common structures 和 Data.
  • Buffered Memory
    資料還來不及儲存到硬碟中暫儲在記憶體的資料.
  • Cached Memory
    資料已經由硬碟中讀取出來,提供給應用程式接下來使用,用以提高存取效能.
  • Available
    估計有多少記憶體可用於啟動新應用程式,無需透過 swapping

超過系統能給的時候 memtester 就不會繼續執行.

root@ubuntu:~# memtester 1G 1
memtester version 4.3.0 (64-bit)
Copyright (C) 2001-2012 Charles Cazabon.
Licensed under the GNU General Public License version 2 (only).

pagesize is 4096
pagesizemask is 0xfffffffffffff000
want 1024MB (1073741824 bytes)
got  1024MB (1073741824 bytes), trying mlock ...Killed
root@ubuntu:~# memtester 700M 1
memtester version 4.3.0 (64-bit)
Copyright (C) 2001-2012 Charles Cazabon.
Licensed under the GNU General Public License version 2 (only).

pagesize is 4096
pagesizemask is 0xfffffffffffff000
want 700MB (734003200 bytes)
got  700MB (734003200 bytes), trying mlock ...locked.
Loop 1/1:
  Stuck Address       : ok         
  Random Value        : ok
  Compare XOR         : ok
  Compare SUB         : ok
  Compare MUL         : ok
  Compare DIV         : ok
  Compare OR          : ok
  Compare AND         : ok
  Sequential Increment: ok
  Solid Bits          : ok         
  Block Sequential    : ok         
  Checkerboard        : ok         
  Bit Spread          : ok         
  Bit Flip            : setting  99Killed

Linux command – smartctl (RAID controllers)

$
0
0

指令 #smartctl – http://benjr.tw/95984 是透過硬碟本身所提供的 S.M.A.R.T. (Self-Monitoring Analysis and Reporting Technology )技術 ,他可以根據檢測屬性的結果來決定該顆硬碟的使用是否快故障.

我們可以透過 #smartctl 提供的參數 -t 來進行測試 http://benjr.tw/96015 . 測試環境為 Ubuntu16.04 .

但是遇到在 RAID 卡底下的硬碟無法透過 smartctl 去偵測,查了官方網站 https://www.smartmontools.org/wiki/Supported_RAID-Controllers 需要透過參數 -d 是指定 RAID 的種類.

-d 有效參數

  • ata
  • scsi
  • sat[,auto][,N][+TYPE]
  • usbcypress[,X]
  • usbjmicron[,p][,x][,N]
  • usbsunplus
  • marvell
  • RAID
    • areca,N/E – Areca SATA[/SAS] RAID controller
    • 3ware,N – LSI 3ware SATA RAID controller
    • hpt,L/M/N – HighPoint RocketRAID SATA RAID controller
    • megaraid,N – LSI MegaRAID SAS RAID controller ,Dell PERC 5/i,6/i controller
    • aacraid,H,L,ID – Adaptec SAS RAID controller
    • cciss,N – CCISS (HP/Compaq Smart Array Controller)
  • auto
  • test

不過 我的 LSI RAID 使用上還是有問題,透過 auto , test 一樣不行正確讀到硬碟的資訊.

root@ubuntu:~# smartctl -a -d megaraid,0 /dev/sdb
smartctl 6.5 2016-01-24 r4214 [x86_64-linux-4.4.0-59-generic] (local build)
Copyright (C) 2002-16, Bruce Allen, Christian Franke, www.smartmontools.org

Smartctl open device: /dev/sdb [megaraid_disk_00] failed: cannot open /dev/megaraid_sas_ioctl_node or /dev/megadev0
root@ubuntu:~#  smartctl -a -d auto /dev/sdb
smartctl 6.2 2013-07-26 r3841 [x86_64-linux-3.13.0-24-generic] (local build)
Copyright (C) 2002-13, Bruce Allen, Christian Franke, www.smartmontools.org

=== START OF INFORMATION SECTION ===
Vendor:               LSILOGIC
Product:              Logical Volume
Revision:             3000
User Capacity:        145,999,527,936 bytes [145 GB]
Logical block size:   512 bytes
Logical Unit id:      0x600508e0000000005412da21f6329200
Device type:          disk
Local Time is:        Tue Jan 17 16:29:19 2017 CST
SMART support is:     Unavailable - device lacks SMART capability.

=== START OF READ SMART DATA SECTION ===

Error Counter logging not supported

Device does not support Self Test logging
root@ubuntu:~#  smartctl -a -d test /dev/sdb
smartctl 6.2 2013-07-26 r3841 [x86_64-linux-3.13.0-24-generic] (local build)
Copyright (C) 2002-13, Bruce Allen, Christian Franke, www.smartmontools.org

/dev/sdb: Device of type 'scsi' [SCSI] detected
/dev/sdb: Device of type 'scsi' [SCSI] opened

Fio –硬碟的壓力測試

$
0
0

要把 Fio 當作硬碟的壓力測試工具,有兩個參數可以使用,關於 FIO 的基礎使用與設定請參考 http://benjr.tw/34632

測試環境為 Ubuntu 16.04 64bit

  • verify=str
    Method of verifying file contents after each iteration of the job. 支援這幾種驗證方式 md5 crc16 crc32 crc32c crc32c-intel crc64 crc7 sha256 sha512 sha1

    上面這幾種都是 One Way Hashes ,他主要會讀取資料並產生一組固定長度字串 (fingerprint ),用這組字串用來比對原資料是否遭到修改,既然無法回推成原資料,那怎知資料是否正確, One Way hash 會再將資料再做一次 One Way hash 然後直接比對 fingerprint 是否一樣.

  • do_verify=bool
    預設值是 true.會在執行 write 之後做資料的驗證(讀取時不需要).

除了這兩個參數外還需要下面的參數

  • –rw=str
    可以設定的參數說明如下.
    • read : Sequential reads. (循序讀)
    • write : Sequential writes. (循序寫)
    • randread : Random reads. (隨機讀)
    • randwrite : Random writes. (隨機寫)
    • rw : Mixed sequential reads and writes. (循序讀寫)
    • randrw : Mixed random reads and writes. (隨機讀寫)
  • –rwmixread=int
    當設定為 Mixed ,同一時間 read 的比例為多少,預設為 50% (50% read + 50% write),也可以用 rwmixwrite=int 來設定,不建議同時使用.
  • –bs=int[,int]
    bs 或是 blocksize ,也就是檔案寫入大小,預設值為 4K,如何設定這個值,因為不同性質的儲存裝置需要不同的值.看你是 File Server,Web server , Database … 設定都會不一樣.可以用逗號 分開設定 read,write

    既然是做壓力測試 block 的設定需要多一點彈性,可以使用下面兩種方式來設定 block size.

  • blocksize_range=irange[,irange], bsrange=irange[,irange]
    我們可以設定一個區間 如 bsrange=1k-4k,2k-8k. 一樣可以用逗號 分開設定 read,write
  • bssplit=str
    也可以用比例的方式來設定 bssplit=blocksize/percentage.

    如 bssplit=4k/10:64k/50:32k/40 將使用 50% 64k blocks, 10% 4k blocks 以及 40% 32k blocks.可以用逗號分開設定 read,write

範例:

root@ubuntu:~# fio --filename=/dev/sdb --direct=1 --rw=randrw --ioengine=libaio --bssplit=4k/10:8K/40:16K/50 --rwmixread=80 --iodepth=16 --numjobs=1 --runtime=60 --group_reporting --name=stresstest --verify=md5 
stresstest: (g=0): rw=randrw, bs=4K-16K/4K-16K/4K-16K, ioengine=libaio, iodepth=16
fio-2.2.10
Starting 1 process
Jobs: 1 (f=1): [m(1)] [100.0% done] [52839KB/13858KB/0KB /s] [6680/1714/0 iops] [eta 00m:00s]
stresstest: (groupid=0, jobs=1): err= 0: pid=5900: Wed Mar  1 23:28:56 2017
  read : io=3939.1MB, bw=67237KB/s, iops=7040, runt= 60003msec
    slat (usec): min=33, max=18948, avg=85.82, stdev=79.60
    clat (usec): min=1, max=195804, avg=1803.90, stdev=1960.51
     lat (usec): min=46, max=195902, avg=1891.06, stdev=1962.46
    clat percentiles (usec):
     |  1.00th=[  290],  5.00th=[  740], 10.00th=[  932], 20.00th=[ 1144],
     | 30.00th=[ 1272], 40.00th=[ 1400], 50.00th=[ 1512], 60.00th=[ 1656],
     | 70.00th=[ 1880], 80.00th=[ 2288], 90.00th=[ 3024], 95.00th=[ 3632],
     | 99.00th=[ 5600], 99.50th=[ 6944], 99.90th=[11584], 99.95th=[14272],
     | 99.99th=[75264]
    bw (KB  /s): min=34488, max=92088, per=100.00%, avg=67376.38, stdev=11607.87
  write: io=989.68MB, bw=16879KB/s, iops=1765, runt= 60003msec
    slat (usec): min=36, max=7549, avg=90.69, stdev=81.23
    clat (usec): min=2, max=191116, avg=1354.20, stdev=1904.96
     lat (usec): min=70, max=191309, avg=1446.37, stdev=1911.79
    clat percentiles (usec):
     |  1.00th=[  253],  5.00th=[  628], 10.00th=[  788], 20.00th=[  940],
     | 30.00th=[ 1048], 40.00th=[ 1128], 50.00th=[ 1208], 60.00th=[ 1288],
     | 70.00th=[ 1400], 80.00th=[ 1576], 90.00th=[ 1976], 95.00th=[ 2416],
     | 99.00th=[ 3920], 99.50th=[ 4896], 99.90th=[10176], 99.95th=[13632],
     | 99.99th=[121344]
    bw (KB  /s): min= 7736, max=23416, per=100.00%, avg=16919.19, stdev=2974.88
    lat (usec) : 2=0.09%, 4=0.09%, 10=0.01%, 20=0.01%, 50=0.06%
    lat (usec) : 100=0.14%, 250=0.50%, 500=1.49%, 750=3.46%, 1000=9.43%
    lat (msec) : 2=61.62%, 4=20.40%, 10=2.56%, 20=0.12%, 50=0.01%
    lat (msec) : 100=0.01%, 250=0.01%
  cpu          : usr=14.47%, sys=77.68%, ctx=15732, majf=0, minf=2476
  IO depths    : 1=0.1%, 2=0.1%, 4=0.1%, 8=0.1%, 16=100.0%, 32=0.0%, >=64=0.0%
     submit    : 0=0.0%, 4=100.0%, 8=0.0%, 16=0.0%, 32=0.0%, 64=0.0%, >=64=0.0%
     complete  : 0=0.0%, 4=100.0%, 8=0.0%, 16=0.1%, 32=0.0%, 64=0.0%, >=64=0.0%
     issued    : total=r=422434/w=105908/d=0, short=r=0/w=0/d=0, drop=r=0/w=0/d=0
     latency   : target=0, window=0, percentile=100.00%, depth=16

Run status group 0 (all jobs):
   READ: io=3939.1MB, aggrb=67237KB/s, minb=67237KB/s, maxb=67237KB/s, mint=60003msec, maxt=60003msec
  WRITE: io=989.68MB, aggrb=16879KB/s, minb=16879KB/s, maxb=16879KB/s, mint=60003msec, maxt=60003msec

Disk stats (read/write):
  sdb: ios=422345/105880, merge=0/0, ticks=375476/45876, in_queue=421220, util=99.65%

當發現錯誤時可以透過 指令 #smartctl 檢測該顆硬碟的錯誤狀態為何.

smartctl 是透過硬碟本身所提供的 S.M.A.R.T. (Self-Monitoring Analysis and Reporting Technology )技術 ,就可以檢測該顆硬碟的 Error count (Errors Corrected by ECC fast | delayed , Errors Corrected by rereads / rewrites , Total errors corrected , Correction algorithm invocations , Total uncorrected errors) 如下所示:

root@ubuntu:~# smartctl -l error /dev/sdb
smartctl 6.2 2013-07-26 r3841 [x86_64-linux-3.13.0-24-generic] (local build)
Copyright (C) 2002-13, Bruce Allen, Christian Franke, www.smartmontools.org
 
=== START OF READ SMART DATA SECTION ===
Error counter log:
           Errors Corrected by           Total   Correction     Gigabytes    Total
               ECC          rereads/    errors   algorithm      processed    uncorrected
           fast | delayed   rewrites  corrected  invocations   [10^9 bytes]  errors
read:          0        0         0         0          0     123263.011           0
write:         0        0         0         0          0       5218.671           0
verify:        0        0         0         0          0         24.721           0
 
Non-medium error count:      148

更多關於 smartctl 的使用請參考 http://benjr.tw/95984

Linux – Stressful Application Test

$
0
0

測試環境為 Ubuntu16.04 64bits

Stressful Application Test (stressapptest) 程式可以在 memory 到 processor 與 I/O 之間產生大量的隨機流量,主要用於模擬系統在高負載情況下的壓力測試,他現在屬於 apache 2.0 license.連 google 也使用這工具是確保系統在高負載下的穩定性.

從 apt-get 就可以安裝.

root@ubuntu:~# apt-get install stressapptest
Reading package lists... Done
Building dependency tree       
Reading state information... Done
The following packages were automatically installed and are no longer required:
  linux-headers-4.4.0-59 linux-headers-4.4.0-59-generic
  linux-image-4.4.0-59-generic linux-image-extra-4.4.0-59-generic
Use 'apt autoremove' to remove them.
The following NEW packages will be installed:
  stressapptest
0 upgraded, 1 newly installed, 0 to remove and 11 not upgraded.
Need to get 127 kB of archives.
After this operation, 377 kB of additional disk space will be used.
Get:1 http://us.archive.ubuntu.com/ubuntu xenial/universe amd64 stressapptest amd64 1.0.6-2 [127 kB]
Fetched 127 kB in 2s (42.4 kB/s)        
Selecting previously unselected package stressapptest.
(Reading database ... 243155 files and directories currently installed.)
Preparing to unpack .../stressapptest_1.0.6-2_amd64.deb ...
Unpacking stressapptest (1.0.6-2) ...
Processing triggers for man-db (2.7.5-1) ...
Setting up stressapptest (1.0.6-2) ...

官方網站說明 stressapptest 適合用於下列幾種測試 https://github.com/stressapptest/stressapptest

  • Stress test: 壓力測試
  • 可當作硬體的驗證與除錯工具
  • 記憶體測試.
  • 硬碟測試.

先來看一下 stressapptest 給的範例 ,測試 256MB 的記憶體 20 秒 並使用參數 8 “warm copy" threads, 以及 8 cpu load threads.

root@ubuntu:~# stressapptest -s 20 -M 256 -m 8 -C 8 -W 
Log: Commandline - stressapptest -s 20 -M 256 -m 8 -C 8 -W
Stats: SAT revision 1.0.6_autoconf, 64 bit binary
Log: buildd @ kapok on Wed Jan 21 17:09:35 UTC 2015 from open source release
Log: 1 nodes, 1 cpus.
Log: Prefer plain malloc memory allocation.
Log: Using memaligned allocation at 0x7ff70959c000.
Stats: Starting SAT, 256M, 20 seconds
Log: Region mask: 0x1
Log: Seconds remaining: 10
Stats: Found 0 hardware incidents
Stats: Completed: 132896.00M in 28.31s 4694.65MB/s, with 0 hardware incidents, 0 errors
Stats: Memory Copy: 132896.00M at 6588.09MB/s
Stats: File Copy: 0.00M at 0.00MB/s
Stats: Net Copy: 0.00M at 0.00MB/s
Stats: Data Check: 0.00M at 0.00MB/s
Stats: Invert Data: 0.00M at 0.00MB/s
Stats: Disk: 0.00M at 0.00MB/s

Status: PASS - please verify no corrected errors

使用的參數:

  • -s seconds : Number of seconds to run
  • -M mbytes : Megabytes of ram to test
  • -m threads : Number of memory copy threads to run
  • -C threads : Number of memory CPU stress threads to run.
  • -W : Use more CPU-stressful memory copy

要將結果導成檔案可以使用參數 -l 想要知道更多的測試結果可以自行調整 verbosity 值.

  • -l logfile : log output to file ‘logfile’ (none)
  • -v level : verbosity (0-20) (default: 8)

看一下執行結果

Stats: Completed: 263982.00M in 20.00s 13197.76MB/s, with 0 hardware incidents, 0 errors
Stats: Memory Copy: 263982.00M at 13200.27MB/s

可以看到只有 Memoey 有流量,其他如 File Copy, Net Copy, Data Check, Invert Data, Disk 皆為 0 .其他流量要如何產生呢!

  • File Copy , Diskhttp://benjr.tw/96762
    File 與 Disk 都是透過硬碟來跟記憶體做存取,不同的是 Disk 是直接使用 RAW Disk 做存取, File 需要在格式化的硬碟空間才能使用.
  • Net Copyhttp://benjr.tw/96766
    可以透過網路來進行測試,需要使用兩台機器來測試外部網路,或是單機的內部網路.
  • Data Check , Invert Datahttp://benjr.tw/96776
    一般的 thread 會將資料從一個區塊複製到另一個區塊 (可以指定是不是要做 Data Check),而 invert thread 會原地反轉資料
  • CPU-Cachehttp://benjr.tw/96768
    用來測試多處理器的快取一致性(cache coherency ).
  • Local Numa / Remote Numa

stressapptest 參數參考表 http://manpages.ubuntu.com/manpages/zesty/man1/stressapptest.1.html

多網段 DHCP

$
0
0

測試環境為 RHEL (RedHat Enterprise Linux) 6.8

如果你的 DHCP Server 有多個網路埠就可以設定成不同網段的 subnet

  • Subnet – 10.0.0.0 (DHCP : 10.0.0.1) eth0
  • Subnet – 172.16.0.0 (DHCP : 172.16.0.1) eth1

[root@benjr ~]# vi /etc/dhcp/dhcpd.conf
default-lease-time 600;
max-lease-time 7200;
subnet 10.0.0.0 netmask 255.255.255.0 {
	option subnet-mask 255.255.255.0;
	option routers 10.0.0.1;
	range 10.0.0.5 10.0.0.15;
}
subnet 172.16.0.0 netmask 255.255.255.0 {
	option subnet-mask 255.255.255.0;
	option routers 172.16.0.1;
	range 172.16.0.5 172.16.0.15;
}

系統預設啟動 DHCP 是使用 eth0,當使用多網段 DHCP 時需要在這裡特別來指定.

[root@benjr ~]# vi /etc/sysconfig/dhcpd
DHCPDARGS="eth0 eth1";

如果要讓這兩個區段能溝通時,可以設定 ip_forward (default gateway 已經都設定為 DHCP Server IP)

[root@benjr ~]# vi /etc/sysctl.conf
net.ipv4.ip_forward=1
     
[root@benjr ~]# sysctl -p
net.ipv4.ip_forward = 1

還有一種是透過 shared-network 的設定方式在單一網路埠設定多個網段,但通常會搭配 VLAN 來使用,請參考 http://benjr.tw/94650

Linux – Stressful Application Test (Disk)

$
0
0

前面有使用過 Stressful Application Test (Stressapptest) http://benjr.tw/96740 這邊針對他的硬碟測試來做說明.

測試環境為 Ubuntu16.04 64bits

File Copy

執行 2 個檔案的 IO threads, 自動檢測 memory 大小與 core 數量以選擇分配的記憶體和記憶體複製線程 (threads).

root@ubuntu:~# stressapptest -f /tmp/file1 -f /tmp/file2
Log: Commandline - stressapptest -f /tmp/file1 -f /tmp/file2
Stats: SAT revision 1.0.6_autoconf, 64 bit binary
Log: buildd @ kapok on Wed Jan 21 17:09:35 UTC 2015 from open source release
Log: 1 nodes, 1 cpus.
Log: Defaulting to 1 copy threads
Log: Total 974 MB. Free 420 MB. Hugepages 0 MB. Targeting 828 MB (84%)
Log: Prefer plain malloc memory allocation.
Log: Using memaligned allocation at 0x7f6c11754000.
Stats: Starting SAT, 828M, 20 seconds
Log: Region mask: 0x1
Log: Seconds remaining: 10
Stats: Found 0 hardware incidents
Stats: Completed: 5580.00M in 20.12s 277.32MB/s, with 0 hardware incidents, 0 errors
Stats: Memory Copy: 1964.00M at 98.03MB/s
Stats: File Copy: 3616.00M at 179.91MB/s
Stats: Net Copy: 0.00M at 0.00MB/s
Stats: Data Check: 0.00M at 0.00MB/s
Stats: Invert Data: 0.00M at 0.00MB/s
Stats: Disk: 0.00M at 0.00MB/s

Status: PASS - please verify no corrected errors

使用參數:

  • -f filename : add a disk thread with tempfile ‘filename’

這一次的測試結果可以看到除了 Memory 外 File Copy 也是有流量了.

Stats: Completed: 5580.00M in 20.12s 277.32MB/s, with 0 hardware incidents, 0 errors
Stats: Memory Copy: 1964.00M at 98.03MB/s
Stats: File Copy: 3616.00M at 179.91MB/s

Disk

使用參數:

  • -d device : Add a direct write disk thread with block device (or file) ‘device’.
root@ubuntu:~# stressapptest -s 60 -M 500 -d /dev/sdb
Log: Commandline - stressapptest -s 60 -M 500 -d /dev/sdb
Stats: SAT revision 1.0.6_autoconf, 64 bit binary
Log: buildd @ kapok on Wed Jan 21 17:09:35 UTC 2015 from open source release
Log: 1 nodes, 1 cpus.
Log: Defaulting to 1 copy threads
Log: Prefer plain malloc memory allocation.
Log: Using memaligned allocation at 0x7f574afeb000.
Stats: Starting SAT, 500M, 60 seconds
Log: Region mask: 0x1
Log: Seconds remaining: 50
Log: Seconds remaining: 40
Log: Seconds remaining: 30
Log: Seconds remaining: 20
Log: Seconds remaining: 10
Stats: Found 0 hardware incidents
Stats: Completed: 321155.00M in 60.03s 5350.13MB/s, with 0 hardware incidents, 0 errors
Stats: Memory Copy: 321086.00M at 5351.13MB/s
Stats: File Copy: 0.00M at 0.00MB/s
Stats: Net Copy: 0.00M at 0.00MB/s
Stats: Data Check: 0.00M at 0.00MB/s
Stats: Invert Data: 0.00M at 0.00MB/s
Stats: Disk: 69.00M at 1.15MB/s

Status: PASS - please verify no corrected errors

其他與硬碟相關的參數:

  • –random-threads number : Number of random threads for each disk write thread.
  • –blocks-per-segment number : Number of blocks to read/write per segment per iteration.
  • –cache-size size : Size of disk cache.
  • –destructive : Write/wipe disk partition.
  • –read-block-size size : Size of block for reading.
  • –read-threshold time : Maximum time (in us) a block read should take.
  • –segment-size size : Size of segments to split disk into.
  • –write-block-size size : Size of block for writing. If not defined, the size of block for writing will be defined as the size of block for reading.
  • –write-threshold time : Maximum time (in us) a block write should take.

File 與 Disk 都是透過硬碟來跟記憶體做存取,不同的是 Disk 是直接使用 RAW Disk 做存取, File 需要在格式化的硬碟空間才能使用.

Linux – Stressful Application Test (Network)

$
0
0

前面有使用過 Stressful Application Test (Stressapptest) http://benjr.tw/96740 這邊針對他的網路測試來做說明.

測試環境為 Ubuntu16.04 64bits

Net Copy

Stressapptest 也可以透過網路來進行測試,需要使用兩台機器,並使用下面兩個參數.

  • -n ipaddr : add a network thread connecting to system at ‘ipaddr’.
  • –listen : run a thread to listen for and respond to network threads.

-n 為待測端要指定 listen 的 IP.另外一台使用 –list 等待資料傳輸.

IP – 172.16.15.130

root@ubuntu:~# stressapptest -s 100 -M 500 --listen

IP – 172.16.15.135

root@ubuntu:~# stressapptest -s 60 -M 500 -n 172.16.15.130 
Log: Commandline - stressapptest -s 60 -M 500 -n 172.16.15.130
Stats: SAT revision 1.0.6_autoconf, 64 bit binary
Log: buildd @ kapok on Wed Jan 21 17:09:35 UTC 2015 from open source release
Log: 1 nodes, 1 cpus.
Log: Defaulting to 1 copy threads
Log: Prefer plain malloc memory allocation.
Log: Using memaligned allocation at 0x7ff109a25000.
Stats: Starting SAT, 500M, 60 seconds
Log: Region mask: 0x1
Log: Seconds remaining: 50
Log: Seconds remaining: 40
Log: Seconds remaining: 30
Log: Seconds remaining: 20
Log: Seconds remaining: 10
Stats: Found 0 hardware incidents
Stats: Completed: 189336.00M in 60.02s 3154.53MB/s, with 0 hardware incidents, 0 errors
Stats: Memory Copy: 184596.00M at 3075.88MB/s
Stats: File Copy: 0.00M at 0.00MB/s
Stats: Net Copy: 4740.00M at 78.98MB/s
Stats: Data Check: 0.00M at 0.00MB/s
Stats: Invert Data: 0.00M at 0.00MB/s
Stats: Disk: 0.00M at 0.00MB/s

Status: PASS - please verify no corrected errors

可以觀察到 Memory 與 Net 皆有傳輸量.

Stats: Completed: 189336.00M in 60.02s 3154.53MB/s, with 0 hardware incidents, 0 errors
Stats: Memory Copy: 184596.00M at 3075.88MB/s
Stats: Net Copy: 4740.00M at 78.98MB/s

我們也可以在單一台系統指定 loopback 127.0.0.1 + listen 為測試網路介面,這樣就不需要額外一台機器做網路測試,但只有傳輸沒有接收的封包,stressapptest 會有 Log: Net thread did not receive any data, exiting 的訊息.

root@ubuntu:~# stressapptest -s 60 -M 500 -n 127.0.0.1 --listen
Log: Commandline - stressapptest -s 60 -M 500 -n 127.0.0.1 --listen
Stats: SAT revision 1.0.6_autoconf, 64 bit binary
Log: buildd @ kapok on Wed Jan 21 17:09:35 UTC 2015 from open source release
Log: 1 nodes, 1 cpus.
Log: Defaulting to 1 copy threads
Log: Prefer plain malloc memory allocation.
Log: Using memaligned allocation at 0x7fc222778000.
Stats: Starting SAT, 500M, 60 seconds
Log: Region mask: 0x1
Log: Seconds remaining: 50
Log: Seconds remaining: 40
Log: Seconds remaining: 30
Log: Seconds remaining: 20
Log: Seconds remaining: 10
Log: Net thread did not receive any data, exiting.
Stats: Found 0 hardware incidents
Stats: Completed: 342930.00M in 60.04s 5711.86MB/s, with 0 hardware incidents, 0 errors
Stats: Memory Copy: 272066.00M at 4534.04MB/s
Stats: File Copy: 0.00M at 0.00MB/s
Stats: Net Copy: 70864.00M at 1180.62MB/s
Stats: Data Check: 0.00M at 0.00MB/s
Stats: Invert Data: 0.00M at 0.00MB/s
Stats: Disk: 0.00M at 0.00MB/s

Status: PASS - please verify no corrected errors

Linux – Stressful Application Test (CPU-Cache)

$
0
0

前面有使用過 Stressful Application Test (Stressapptest) http://benjr.tw/96740 這邊針對他的 CPU-Cache 測試來做說明.

測試環境為 Ubuntu16.04 64bits

CPU-Cache

測試多處理器的快取一致性(cache coherency ),確認系統不會因為在快取記憶體中的資料不一致所產生的問題.

  • –cc_test : Do the cache coherency testing.
root@ubuntu:~# stressapptest -s 60 --cc_test
Log: Commandline - stressapptest -s 60 --cc_test
Stats: SAT revision 1.0.6_autoconf, 64 bit binary
Log: buildd @ kapok on Wed Jan 21 17:09:35 UTC 2015 from open source release
Log: 1 nodes, 1 cpus.
Log: Defaulting to 1 copy threads
Log: Total 974 MB. Free 568 MB. Hugepages 0 MB. Targeting 828 MB (84%)
Log: Prefer plain malloc memory allocation.
Log: Using memaligned allocation at 0x7f854cf28000.
Stats: Starting SAT, 828M, 60 seconds
Log: Region mask: 0x1
Log: Seconds remaining: 50
Log: Seconds remaining: 40
Log: Seconds remaining: 30
Log: Seconds remaining: 20
Log: Seconds remaining: 10
Stats: CC Thread(0): Time=60056521 us, Increments=2811339000, Increments/sec = 46811552.737129
Stats: Found 0 hardware incidents
Stats: Completed: 41182.00M in 61.05s 674.61MB/s, with 0 hardware incidents, 0 errors
Stats: Memory Copy: 41182.00M at 685.66MB/s
Stats: File Copy: 0.00M at 0.00MB/s
Stats: Net Copy: 0.00M at 0.00MB/s
Stats: Data Check: 0.00M at 0.00MB/s
Stats: Invert Data: 0.00M at 0.00MB/s
Stats: Disk: 0.00M at 0.00MB/s

Status: PASS - please verify no corrected errors

其他與 CPU-Cache 相關的參數:

  • –cc_inc_count number : Number of times to increment the cacheline’s member.
  • –cc_line_count number : Mumber of cache line sized datastructures to allocate for the cache coherency threads to operate.

Linux – Stressful Application Test (Memory)

$
0
0

前面有使用過 Stressful Application Test (Stressapptest) http://benjr.tw/96740 這邊針對他的 記憶體 測試詳細來做說明.

測試環境為 Ubuntu16.04 64bits

Memory

與記憶體相關的參數

  • -m threads : Number of memory copy threads to run.
  • -C (c) threads : Number of memory CPU stress threads to run.-c (小寫) 會做 Data Check
  • -i threads : Number of memory invert threads to run.

主要測試記憶體的參數是 -m (auto-detect to number of CPUs),就算不設定,預設系統會幫我們自動偵測 CPU 數,然後搭配一樣個數的 threads 來進行測試.此時透過 top 來觀看 CPU 的使用率幾乎都達 100%.

如果你還想再加入更多的 thread 來進行測試,可以使用 -C 繼續增加 thread ,或是 -i 加入 invert thread (一般的 thread 會將資料從一個區塊複製到另一個區塊,而 invert thread 會原地反轉資料.)

一般不指定 thread 透過 stressapptest 來自動偵測 (CPU 數然後搭配一樣個數的 thread).

root@ubuntu:~# stressapptest -s 60 -M 4000
Log: Commandline - stressapptest -s 60 -M 4000
Stats: SAT revision 1.0.6_autoconf, 64 bit binary
Log: buildd @ kapok on Wed Jan 21 17:09:35 UTC 2015 from open source release
Log: 1 nodes, 16 cpus.
Log: Defaulting to 16 copy threads
Log: Prefer plain malloc memory allocation.
Log: Using memaligned allocation at 0x7fb3d4412000.
Stats: Starting SAT, 4000M, 60 seconds
Log: Region mask: 0x1
Log: Seconds remaining: 50
Log: Seconds remaining: 40
Log: Seconds remaining: 30
Log: Seconds remaining: 20
Log: Seconds remaining: 10
Stats: Found 0 hardware incidents
Stats: Completed: 812878.00M in 60.05s 13537.25MB/s, with 0 hardware incidents, 0 errors
Stats: Memory Copy: 812878.00M at 13544.86MB/s
Stats: File Copy: 0.00M at 0.00MB/s
Stats: Net Copy: 0.00M at 0.00MB/s
Stats: Data Check: 0.00M at 0.00MB/s
Stats: Invert Data: 0.00M at 0.00MB/s
Stats: Disk: 0.00M at 0.00MB/s

Status: PASS - please verify no corrected errors

可以透過 #pstress 觀看 threads 數量 (總 threads : 18, CPU core 16 + 2 threads?)

root@ubuntu:~# pstree |grep -i stress
-gnome-terminal--+-bash---sudo---su---bash---stressapptest---18*[{stressapptest}]

透過 -c (小寫, 會做 Data Check) 繼續增加 threads 數量.

root@ubuntu:~# stressapptest -s 60 -M 4000 -c 8
Log: Commandline - stressapptest -s 60 -M 4000 -c 8
Stats: SAT revision 1.0.6_autoconf, 64 bit binary
Log: buildd @ kapok on Wed Jan 21 17:09:35 UTC 2015 from open source release
Log: 1 nodes, 16 cpus.
Log: Defaulting to 16 copy threads
Log: Prefer plain malloc memory allocation.
Log: Using memaligned allocation at 0x7f779000a000.
Stats: Starting SAT, 4000M, 60 seconds
Log: Region mask: 0x1
Log: Seconds remaining: 50
Log: Seconds remaining: 40
Log: Seconds remaining: 30
Log: Seconds remaining: 20
Log: Seconds remaining: 10
Stats: Found 0 hardware incidents
Stats: Completed: 897459.00M in 60.13s 14925.17MB/s, with 0 hardware incidents, 0 errors
Stats: Memory Copy: 693924.00M at 11563.15MB/s
Stats: File Copy: 0.00M at 0.00MB/s
Stats: Net Copy: 0.00M at 0.00MB/s
Stats: Data Check: 203535.00M at 3385.54MB/s
Stats: Invert Data: 0.00M at 0.00MB/s
Stats: Disk: 0.00M at 0.00MB/s

Status: PASS - please verify no corrected errors

(總 threads : 26), CPU core 16 + 8 + 2 threads?

root@ubuntu:~# pstree |grep -i stress
-gnome-terminal--+-bash---sudo---su---bash---stressapptest---26*[{stressapptest}]

加入 8個 invert threads 數量.

root@ubuntu:~# stressapptest -s 60 -M 4000 -i 8
Log: Commandline - stressapptest -s 60 -M 4000 -i 8
Stats: SAT revision 1.0.6_autoconf, 64 bit binary
Log: buildd @ kapok on Wed Jan 21 17:09:35 UTC 2015 from open source release
Log: 1 nodes, 16 cpus.
Log: Defaulting to 16 copy threads
Log: Prefer plain malloc memory allocation.
Log: Using memaligned allocation at 0x7fda35d62000.
Stats: Starting SAT, 4000M, 60 seconds
Log: Region mask: 0x1
Log: Seconds remaining: 50
Log: Seconds remaining: 40
Log: Seconds remaining: 30
Log: Seconds remaining: 20
Log: Seconds remaining: 10
Stats: Found 0 hardware incidents
Stats: Completed: 975798.00M in 60.03s 16255.22MB/s, with 0 hardware incidents, 0 errors
Stats: Memory Copy: 681182.00M at 11349.21MB/s
Stats: File Copy: 0.00M at 0.00MB/s
Stats: Net Copy: 0.00M at 0.00MB/s
Stats: Data Check: 0.00M at 0.00MB/s
Stats: Invert Data: 294616.00M at 4909.51MB/s
Stats: Disk: 0.00M at 0.00MB/s

Status: PASS - please verify no corrected errors

(總 threads : 26), CPU core 16 + 8 + 2 threads?

root@ubuntu:~# pstree |grep -i stress
-gnome-terminal--+-bash---sudo---su---bash---stressapptest---26*[{stressapptest}]

NUMA (Non-uniform memory access)

$
0
0

多核心的處理器最早是透過對稱多處理 SMP (Symmetric multiprocessing) 的方式,所有的 CPU 核心對於記憶體的存取是共用的,但是當 CPU 核心數太多時反而是一個限制,當不同的處理器需要交換資料時都是透過系統匯流排將資料儲存在記憶體中,但當核心數多時,交換資料變成常態, CPU 與記憶體之間的速度跟不上 CPU 處理的速度.越多的核心反而讓整體效能降低.

因此有了 Intel 的 NUMA (Non-uniform memory access),他把 CPU 與記憶體區分成不同的結點 Node (不同的 CPU 各自擁有記憶體),彼此的 CPU 節點再透過 QPI (Intel QuickPath Interconnect) 這個介面做溝通.

關於 CPU 的演進可以參考鳥哥網站 http://linux.vbird.org/linux_enterprise/cputune.php

測試環境為 Ubuntu 16.04 64bits

來看一下我系統的下的 NUMA 狀態,可以使用 numactl , numastat 這兩個指令,為非預設安裝,需要透過 apt 來安裝.

root@ubuntu:~# apt-get install numactl
Reading package lists... Done
Building dependency tree       
Reading state information... Done
The following package was automatically installed and is no longer required:
  ubuntu-core-launcher
Use 'apt autoremove' to remove it.
The following NEW packages will be installed:
  numactl
0 upgraded, 1 newly installed, 0 to remove and 0 not upgraded.
Need to get 30.2 kB of archives.
After this operation, 117 kB of additional disk space will be used.
Get:1 http://tw.archive.ubuntu.com/ubuntu xenial/universe amd64 numactl amd64 2.0.11-1ubuntu1 [30.2 kB]
Fetched 30.2 kB in 0s (40.9 kB/s)
Selecting previously unselected package numactl.
(Reading database ... 205238 files and directories currently installed.)
Preparing to unpack .../numactl_2.0.11-1ubuntu1_amd64.deb ...
Unpacking numactl (2.0.11-1ubuntu1) ...
Processing triggers for man-db (2.7.5-1) ...
Setting up numactl (2.0.11-1ubuntu1) ...

透過 numastat 可以看到我的系統有兩個 Node (Node0 與 Node1)

root@ubuntu:~# numastat 
                           node0           node1
numa_hit                 6018617         4385882
numa_miss                      0               0
numa_foreign                   0               0
interleave_hit              4800           15116
local_node               6003635         4380820
other_node                 14982            5062

上面的數值所代表

  • numa_hit
    Memory successfully allocated on this node as intended.
    記憶體成功配置至此節點
  • numa_miss
    Memory allocated on this node despite the process preferring some different node. Each numa_miss has a numa_foreign on another node.
    原先預定的節點的記憶體不足,而配置至此節點. numa_miss 與另一個節點的 numa_foreign 是相對應的.
  • numa_foreign
    Memory intended for this node, but actually allocated on some different node. Each numa_foreign has a numa_miss on another node.
    原先預定至此節點的記憶體但被配置至其他節點上. numa_foreign 與另一個節點的 numa_miss 是相對應的.
  • interleave_hit
    Interleaved memory successfully allocated on this node as intended.
    The number of interleave policy allocations that were intended for a specific node and succeeded there.
  • local_node
    Memory allocated on this node while a process was running on it.
    該節點上的程序成功配置到該節點的記憶體空間.
  • other_node
    Memory allocated on this node while a process was running on some other node.
    該節點上的程序,成功配置到另一個節點的記憶體空間.

numactl 指令參考
–hardware , -H : Show inventory of available node on the system.

root@ubuntu:~# numactl --hardware
available: 2 nodes (0-1)
node 0 cpus: 0 1 2 3 8 9 10 11
node 0 size: 3939 MB
node 0 free: 3034 MB
node 1 cpus: 4 5 6 7 12 13 14 15
node 1 size: 4029 MB
node 1 free: 3468 MB
node distances:
node   0   1 
  0:  10  20 
  1:  20  10 

–show, -s : Show NUMA policy setting of the current process.

root@ubuntu:~#  numactl --show
policy: default
preferred node: current
physcpubind: 0 1 2 3 4 5 6 7 8 9 10 11 12 13 14 15 
cpubind: 0 1 
nodebind: 0 1 
membind: 0 1 

Linux – Stressful Application Test (NUMA)

$
0
0

前面有使用過 Stressful Application Test (Stressapptest) http://benjr.tw/96740 這邊針對他的記憶體 NUMA 測試來做說明.

測試環境為 Ubuntu16.04 64bits

NUMA (Non-uniform memory access)

NUMA (Non-uniform memory access) 把 CPU 與記憶體區分成不同的結點 Node (不同的 CPU 各自擁有記憶體),彼此的 CPU 節點再透過 QPI (Intel QuickPath Interconnect) 這個介面做溝通.
關於 NUMA 請參考 http://benjr.tw/96788

與 NUMA 相關參數

  • –local_numa :
    choose memory regions associated with each CPU to be tested by that CPU ,使用該節點上的記憶體空間.
  • –remote_numa :
    choose memory regions not associated with each CPU to be tested by that .使用另一個節點的記憶體空間.

測試環境為 Ubuntu 16.04 64bits
透過 numastat 可以看到我的系統有兩個 Node (Node0 與 Node1)

root@ubuntu:~# numastat
                           node0           node1
numa_hit                  684516          565302
numa_miss                      0               0
numa_foreign                   0               0
interleave_hit              4908           15701
local_node                682033          546987
other_node                  2483           18315

上面的數值所代表

  • numa_hit
    Memory successfully allocated on this node as intended.
    記憶體成功配置至此節點
  • numa_miss
    Memory allocated on this node despite the process preferring some different node. Each numa_miss has a numa_foreign on another node.
    原先預定的節點的記憶體不足,而配置至此節點. numa_miss 與另一個節點的 numa_foreign 是相對應的.
  • numa_foreign
    Memory intended for this node, but actually allocated on some different node. Each numa_foreign has a numa_miss on another node.
    原先預定至此節點的記憶體但被配置至其他節點上. numa_foreign 與另一個節點的 numa_miss 是相對應的.
  • interleave_hit
    Interleaved memory successfully allocated on this node as intended.
    The number of interleave policy allocations that were intended for a specific node and succeeded there.
  • local_node
    Memory allocated on this node while a process was running on it.
    該節點上的程序成功配置到該節點的記憶體空間.
  • other_node
    Memory allocated on this node while a process was running on some other node.
    該節點上的程序,成功配置到另一個節點的記憶體空間.

測試 local_numa

root@ubuntu:~# stressapptest -s 30 -M 500 --local_numa
Log: Commandline - stressapptest -s 30 -M 500 --local_numa
Stats: SAT revision 1.0.6_autoconf, 64 bit binary
Log: buildd @ kapok on Wed Jan 21 17:09:35 UTC 2015 from open source release
Log: 1 nodes, 16 cpus.
Log: Defaulting to 16 copy threads
Log: Prefer plain malloc memory allocation.
Log: Using memaligned allocation at 0x7fc80ed5d000.
Stats: Starting SAT, 500M, 30 seconds
Log: Region mask: 0x1
Log: Seconds remaining: 20
Log: Seconds remaining: 10
Stats: Found 0 hardware incidents
Stats: Completed: 409174.00M in 30.00s 13637.74MB/s, with 0 hardware incidents, 0 errors
Stats: Memory Copy: 409174.00M at 13638.94MB/s
Stats: File Copy: 0.00M at 0.00MB/s
Stats: Net Copy: 0.00M at 0.00MB/s
Stats: Data Check: 0.00M at 0.00MB/s
Stats: Invert Data: 0.00M at 0.00MB/s
Stats: Disk: 0.00M at 0.00MB/s

Status: PASS - please verify no corrected errors

local_node 明顯增加 node0 – 682033(測試前) 701210(測試後) , node1 – 546987(測試前) 571896(測試後) , other_node 沒有增加.

root@ubuntu:~# numastat
                           node0           node1
numa_hit                  703693          590211
numa_miss                      0               0
numa_foreign                   0               0
interleave_hit              4908           15701
local_node                701210          571896
other_node                  2483           18315

測試 remote_numa

root@ubuntu:~# stressapptest -s 30 -M 500 --remote_numa
Log: Commandline - stressapptest -s 30 -M 500 --remote_numa
Stats: SAT revision 1.0.6_autoconf, 64 bit binary
Log: buildd @ kapok on Wed Jan 21 17:09:35 UTC 2015 from open source release
Log: 1 nodes, 16 cpus.
Log: Defaulting to 16 copy threads
Log: Prefer plain malloc memory allocation.
Log: Using memaligned allocation at 0x7fe0490a9000.
Stats: Starting SAT, 500M, 30 seconds
Log: Region mask: 0x1
Log: Seconds remaining: 20
Log: Seconds remaining: 10
Stats: Found 0 hardware incidents
Stats: Completed: 419376.00M in 30.01s 13976.86MB/s, with 0 hardware incidents, 0 errors
Stats: Memory Copy: 419376.00M at 13977.69MB/s
Stats: File Copy: 0.00M at 0.00MB/s
Stats: Net Copy: 0.00M at 0.00MB/s
Stats: Data Check: 0.00M at 0.00MB/s
Stats: Invert Data: 0.00M at 0.00MB/s
Stats: Disk: 0.00M at 0.00MB/s

Status: PASS - please verify no corrected errors

Remote NUMA 測試出來的值 Memory Copy: 419376.00M , 13977.69MB/s 與 Local NUMA – Memory Copy: 409174.00M , 13638.94MB/s 並無明顯的差別.

local_node 明顯增加 node0 – 701210 (測試前) 728102(測試後) , node1 – 571896(測試前) 598015(測試後) ,奇怪的是 other_node 沒有增加.

root@ubuntu:~# numastat
                           node0           node1
numa_hit                  730585          616330
numa_miss                      0               0
numa_foreign                   0               0
interleave_hit              4908           15701
local_node                728102          598015
other_node                  2483           18315

Linux command – tcpdump

$
0
0

有時候設定一些跟網路相關的服務,服務雖然是啟動的,但是功能卻是有問題,這時候可透過 #tcpdump 這個指令來觀看目前封包的狀況.

測試環境為 Ubuntu 16.04 64bits

直接下 tcpdump 就可以看到所有的封包,但資料量太大了,封包資訊一下就過去了,可以加入參數來使用.

root@ubuntu:~# tcpdump
01:12:49.391892 IP 172.16.15.1.56792 > 172.16.15.208.ssh: Flags [.], ack 4256592, win 4081, options [nop,nop,TS val 864031640 ecr 535604], length 0
01:12:49.391917 IP 172.16.15.208.ssh > 172.16.15.1.56792: Flags [P.], seq 4257056:4257448, ack 2521, win 294, options [nop,nop,TS val 535604 ecr 864031640], length 392
...
^c
1561 packets captured
18232 packets received by filter
16665 packets dropped by kernel

promiscuous mode (混雜模式),讓網卡能接收所有經過它的封包,不管其目的地址是否與他有關.

root@ubuntu:~# dmesg
...
[   50.984751] device ens33 entered promiscuous mode
[   62.948837] device ens33 left promiscuous mode

-i interface

– 指定 tcpdump 所要監看的網路介面.

root@ubuntu:~# tcpdump -i ens33

-q

– Quick (quiet) 的封包輸出.封包以較少的資訊輸出.

root@ubuntu:~# tcpdump -i ens33 -q
...
01:13:33.487482 IP 172.16.15.1.56792 > 172.16.15.208.ssh: tcp 0
01:13:33.487502 IP 172.16.15.208.ssh > 172.16.15.1.56792: tcp 200

-w file

– Write the raw packets to file rather than parsing and printing them out.

-r file

– Read packets from file
有時候來不及直接看內容,建議可以儲存到檔案來觀看, -w 寫入檔案(raw packets), -r 讀取檔案

root@ubuntu:~# tcpdump -i ens33 -w tcpdump.txt
tcpdump: listening on ens33, link-type EN10MB (Ethernet), capture size 262144 bytes
^C6 packets captured
7 packets received by filter
0 packets dropped by kernel
root@ubuntu:~# ls
tcpdump.txt
root@ubuntu:~# tcpdump -r tcpdump.txt
reading from file tcpdump.txt, link-type EN10MB (Ethernet)
01:24:48.774307 IP 172.16.15.208.ssh > 172.16.15.1.56792: Flags [P.], seq 2365396806:2365396850, ack 3797073080, win 294, options [nop,nop,TS val 715449 ecr 864741399], length 44
....

-nn

– 使用 IP 及 port number 來顯示(預設會顯示已知的主機與服務名稱).

root@ubuntu:~# tcpdump -i ens33 -nn 
01:48:15.861678 IP 172.16.15.208.22 > 172.16.15.1.56792: Flags [P.], seq 3176652:3177904, ack 1909, win 294, options [nop,nop,TS val 1067221 ecr 866140693], length 1252

沒使用時會顯示成 ssh (非 22 port)

root@ubuntu:~# tcpdump -i ens33
02:18:42.435672 IP 172.16.15.208.ssh > 172.16.15.1.56792: Flags [P.], seq 3655568:3655960, ack 2161, win 294, options [nop,nop,TS val 1523865 ecr 867961826], length 392

port

– 指定監視的埠 port , 可以是數字,也可以是服務名稱

root@ubuntu:~# tcpdump -i ens33 -nn port 22
....
02:21:01.052584 IP 172.16.15.1.56792 > 172.16.15.208.22: Flags [.], ack 11096912, win 4078, options [nop,nop,TS val 868099150 ecr 1558519], length 0
02:21:01.052605 IP 172.16.15.208.22 > 172.16.15.1.56792: Flags [P.], seq 11097420:11097632, ack 6625, win 294, options [nop,nop,TS val 1558519 ecr 868099150], length 212
02:21:01.052830 IP 172.16.15.1.56792 > 172.16.15.208.22: Flags [.], ack 11097420, win 4080, options [nop,nop,TS val 868099151 ecr 1558519], length 0
^C
57115 packets captured
57147 packets received by filter
30 packets dropped by kernel
root@ubuntu:~# tcpdump -i ens33 -nn port ssh
02:25:20.581604 IP 172.16.15.1.56792 > 172.16.15.208.ssh: Flags [.], ack 2214756, win 4083, options [nop,nop,TS val 868356938 ecr 1623401], length 0

host

– 指定監視的 host , 還可以指定 src (Source),也可以是 dst (destination)

root@ubuntu:~# tcpdump -i ens33 host 172.16.15.208
root@ubuntu:~# tcpdump -i ens33 src host 172.16.15.208
...
02:26:52.539255 IP 172.16.15.208.ssh > 172.16.15.1.56792: Flags [P.], seq 1092476:1092680, ack 613, win 294, options [nop,nop,TS val 1646391 ecr 868448203], length 204
02:26:52.539466 IP 172.16.15.208.ssh > 172.16.15.1.56792: Flags [P.], seq 1092680:1092884, ack 613, win 294, options [nop,nop,TS val 1646391 ecr 868448203], length 204
^C
5275 packets captured
5284 packets received by filter
9 packets dropped by kernel

net

– host 只能針對單一的 Host ,net 可以針對某個網域進行封包的監視.

root@ubuntu:~# tcpdump -i ens33 net 172.16

and & or

– 剛剛那些篩選條件還可以使用 and (所有條件都需要成立) 或是 or (其中一個條件成立即可)

root@ubuntu:~# tcpdump -i ens33 'port ssh and src host 172.16.15.208' 
root@ubuntu:~# tcpdump -i ens33 'port ssh or src host 172.16.15.208'

-v , -vv , -vvv

– 更詳細的輸出.

root@ubuntu:~# tcpdump -i ens33 -v ip6 
root@ubuntu:~# tcpdump -i ens33 -vv ip6

udp

– 預設監控 tcp 也可以指定為 udp

root@ubuntu:~# tcpdump -i ens33 udp
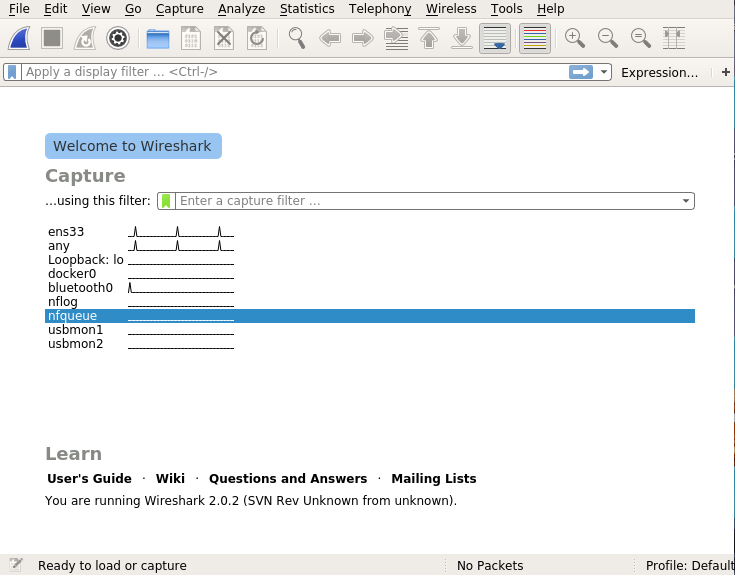
wireshark

– 不習慣用文字介面,還可以選擇圖示的 wireshark

root@ubuntu:~# apt install wireshark
root@ubuntu:~# wireshark

Viewing all 145 articles
Browse latest View live